Tadiwanashe Ben | Portfolio
Data Scientist & Analyst specializing in predictive modeling, statistical analysis, and translating complex datasets into actionable business intelligence.
🚗 ZimAuto: End-to-End Car Valuation & Arbitrage Engine




📌 1. Executive Summary & Objective
The secondary automobile market in Zimbabwe suffers from significant pricing asymmetry, inconsistent valuation metrics, and market opacity. Buyers and sellers frequently struggle to determine the true fair market value of vehicles due to non-linear depreciation curves, varying mileage velocities, and brand prestige premiums.
The objective of this project was to build an end-to-end, data-driven machine learning system that:
- Scrapes and sanitizes live automotive classifieds across regional platforms.
- Models non-linear depreciation dynamics across vehicle age, usage rate, brand, transmission, and market segment.
- Resolves low-end market overvaluation using target log-transformation algorithms.
- Deploys an interactive web interface providing fair market valuations, confidence scores, and real-world bargaining bounds.
📊 2. Exploratory Data Analysis & Market Insights
A. Chronological Depreciation Patterns
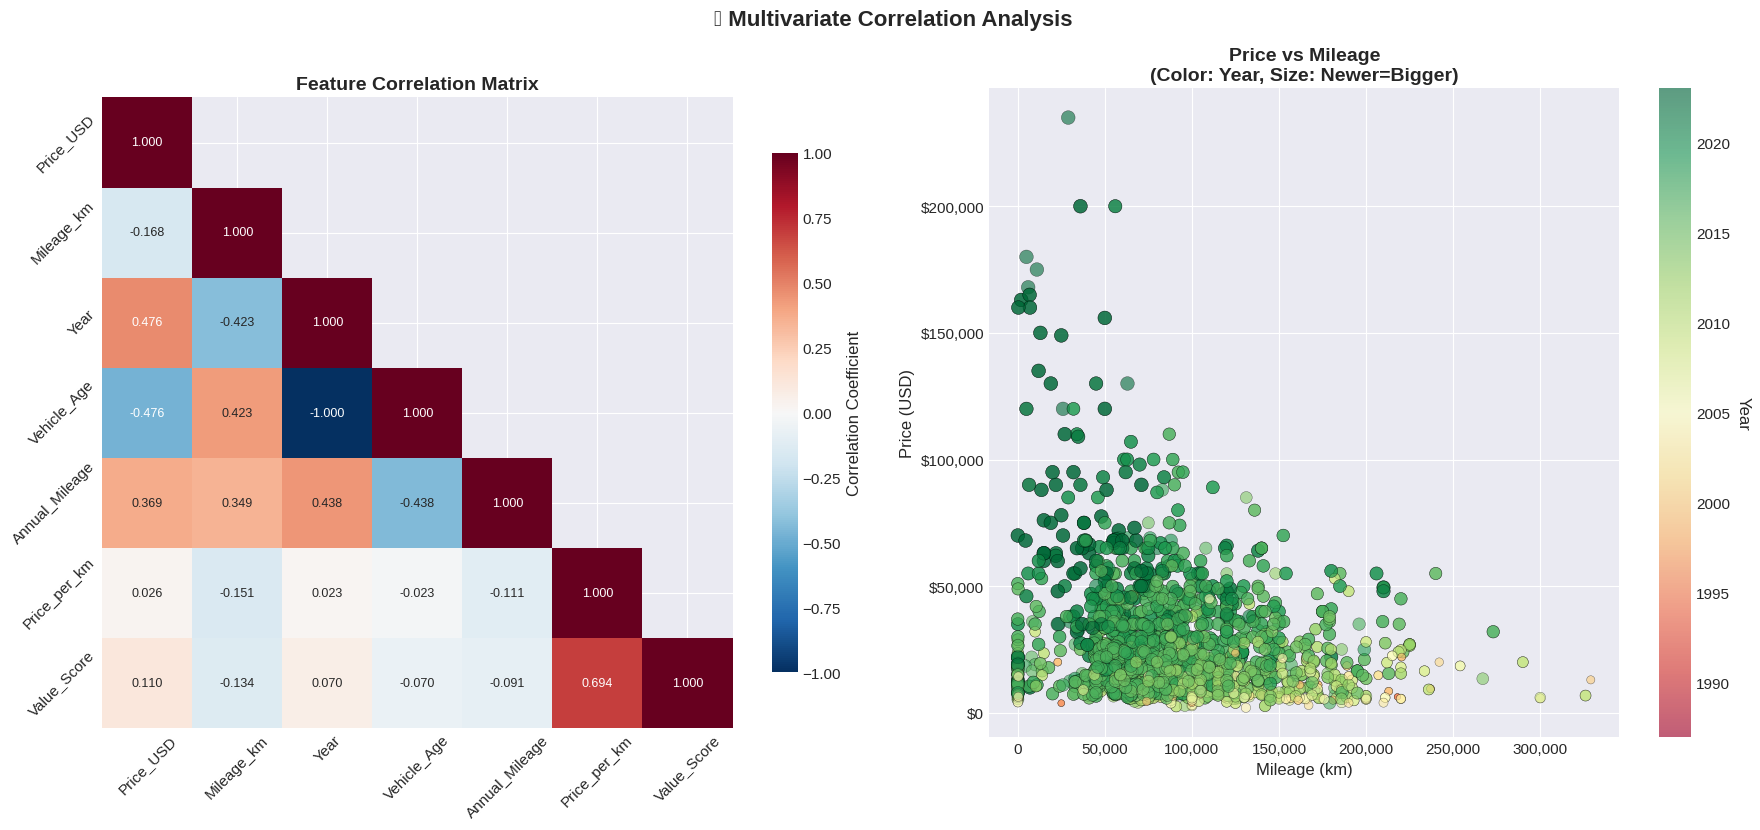
Analyzing vehicle price against manufacturing year and age reveals strong exponential depreciation dynamics. Newer vehicles lose value rapidly within their first five years before stabilizing into a steady baseline curve.
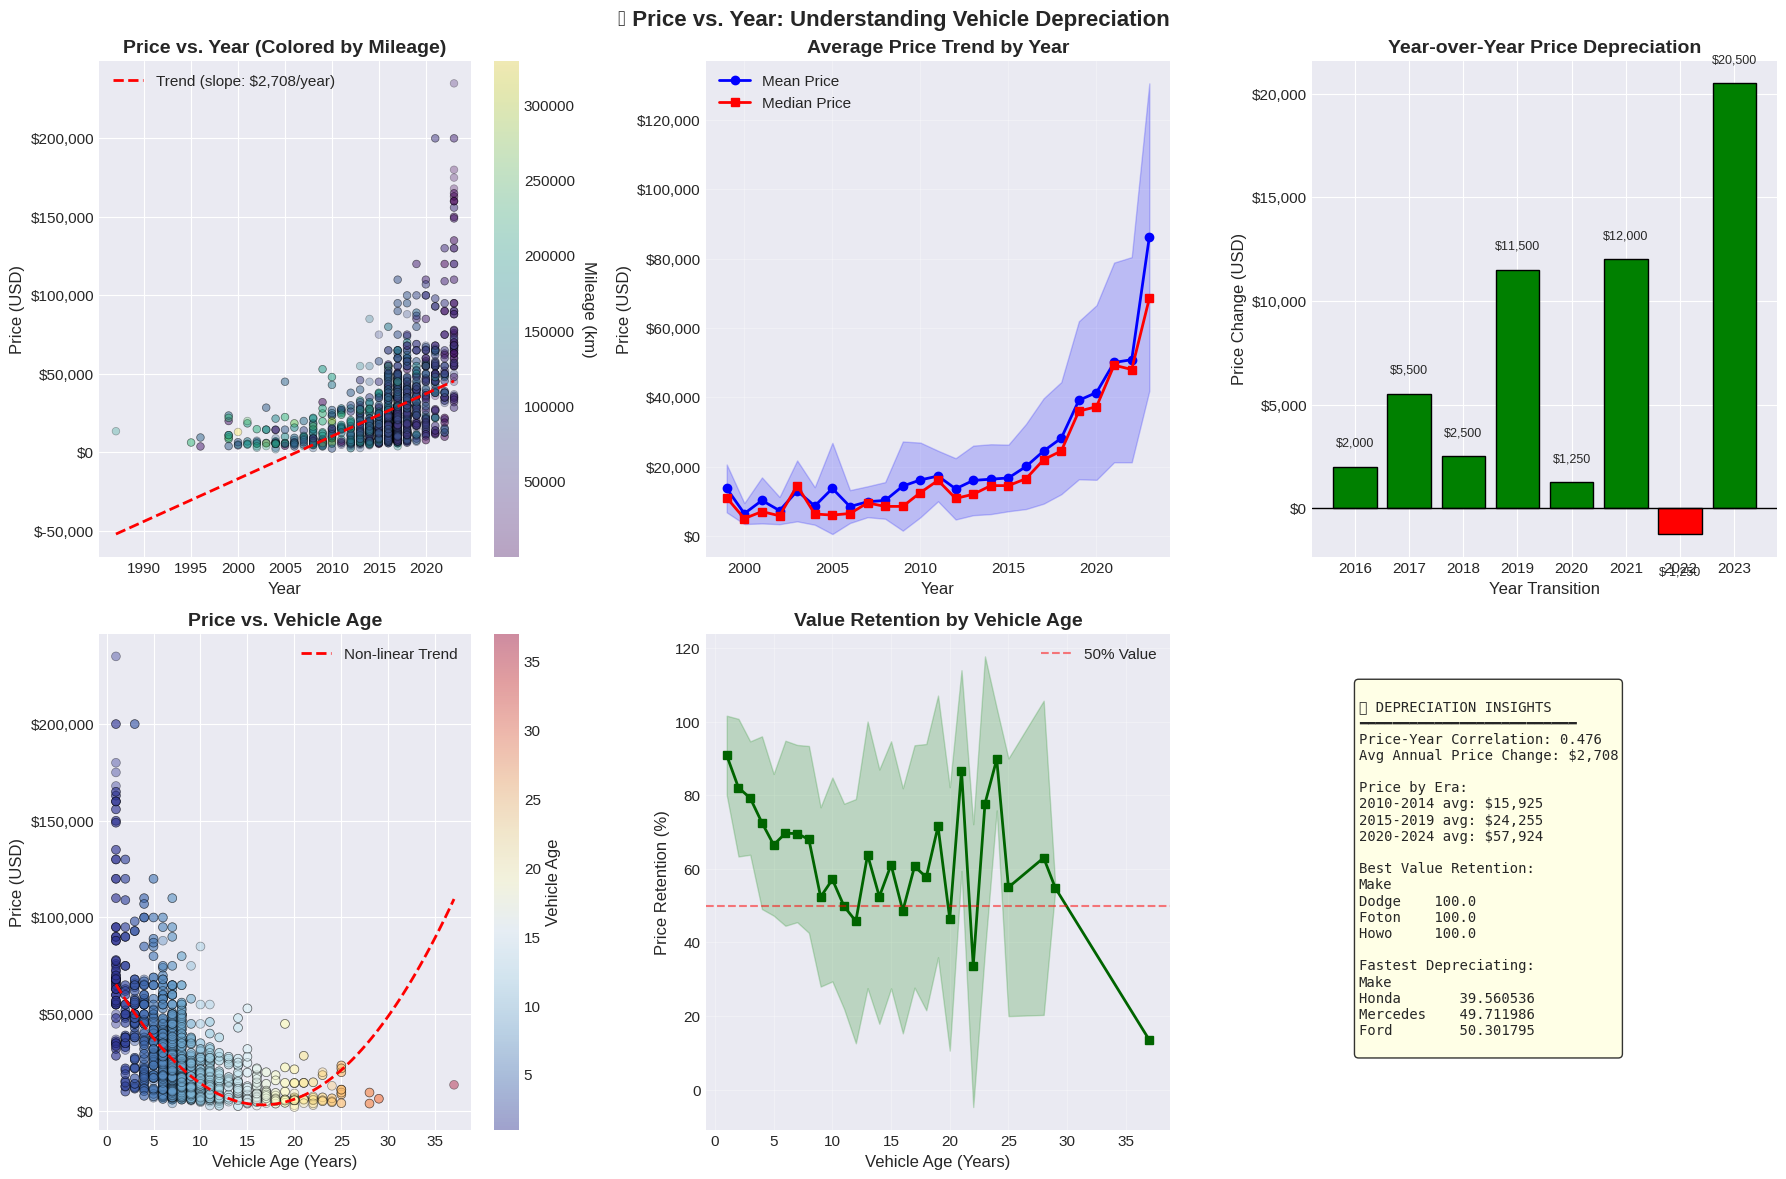
Key Takeaway: Vehicle prices correlate positively with year ($r = 0.476$). The average price jumps significantly for post-2020 inventory due to import tariff structures and newer technology baselines.
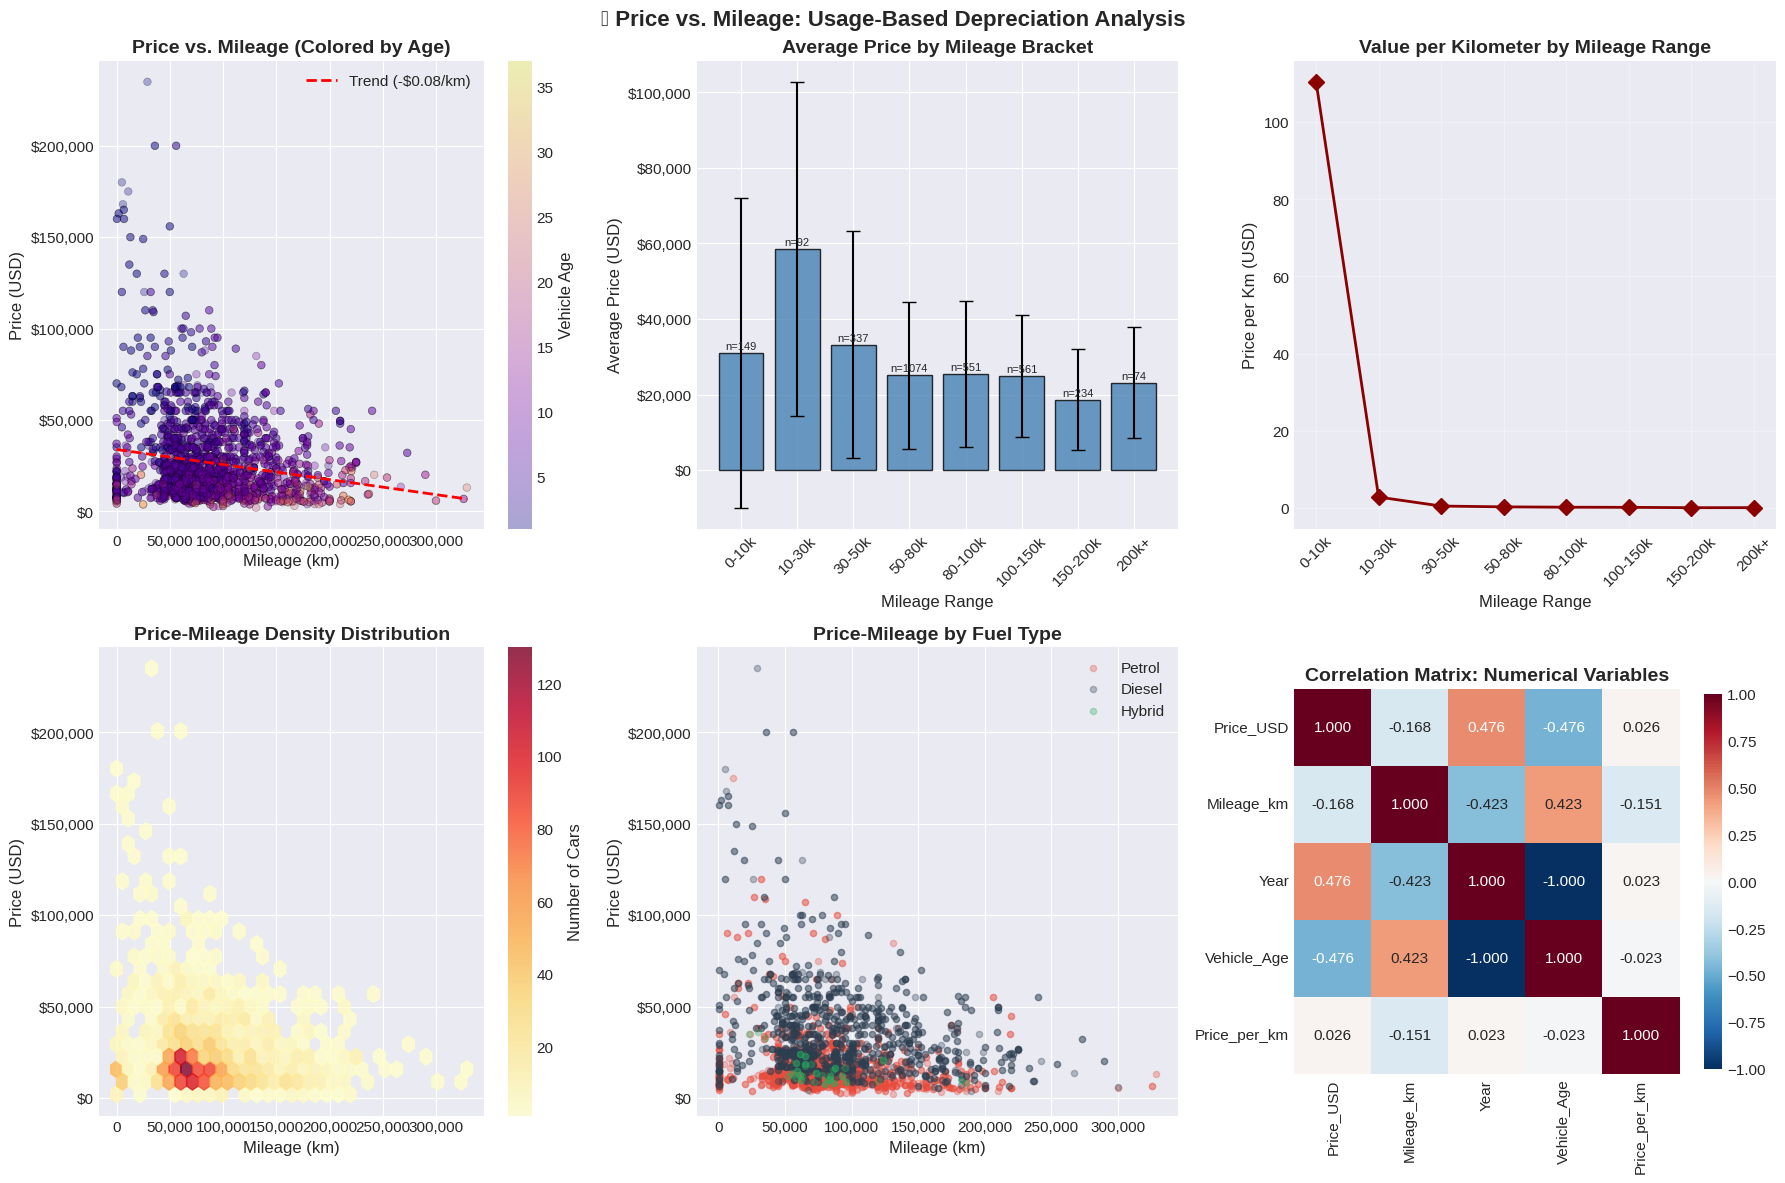
B. Usage-Based Depreciation (Mileage Analysis)
Cumulative mileage acts as a continuous penalty against asset valuation. However, value loss per kilometer decays exponentially—the highest drop in value occurs within the first $30,000\text{ km}$.
C. Brand Premiums & Market Dominance
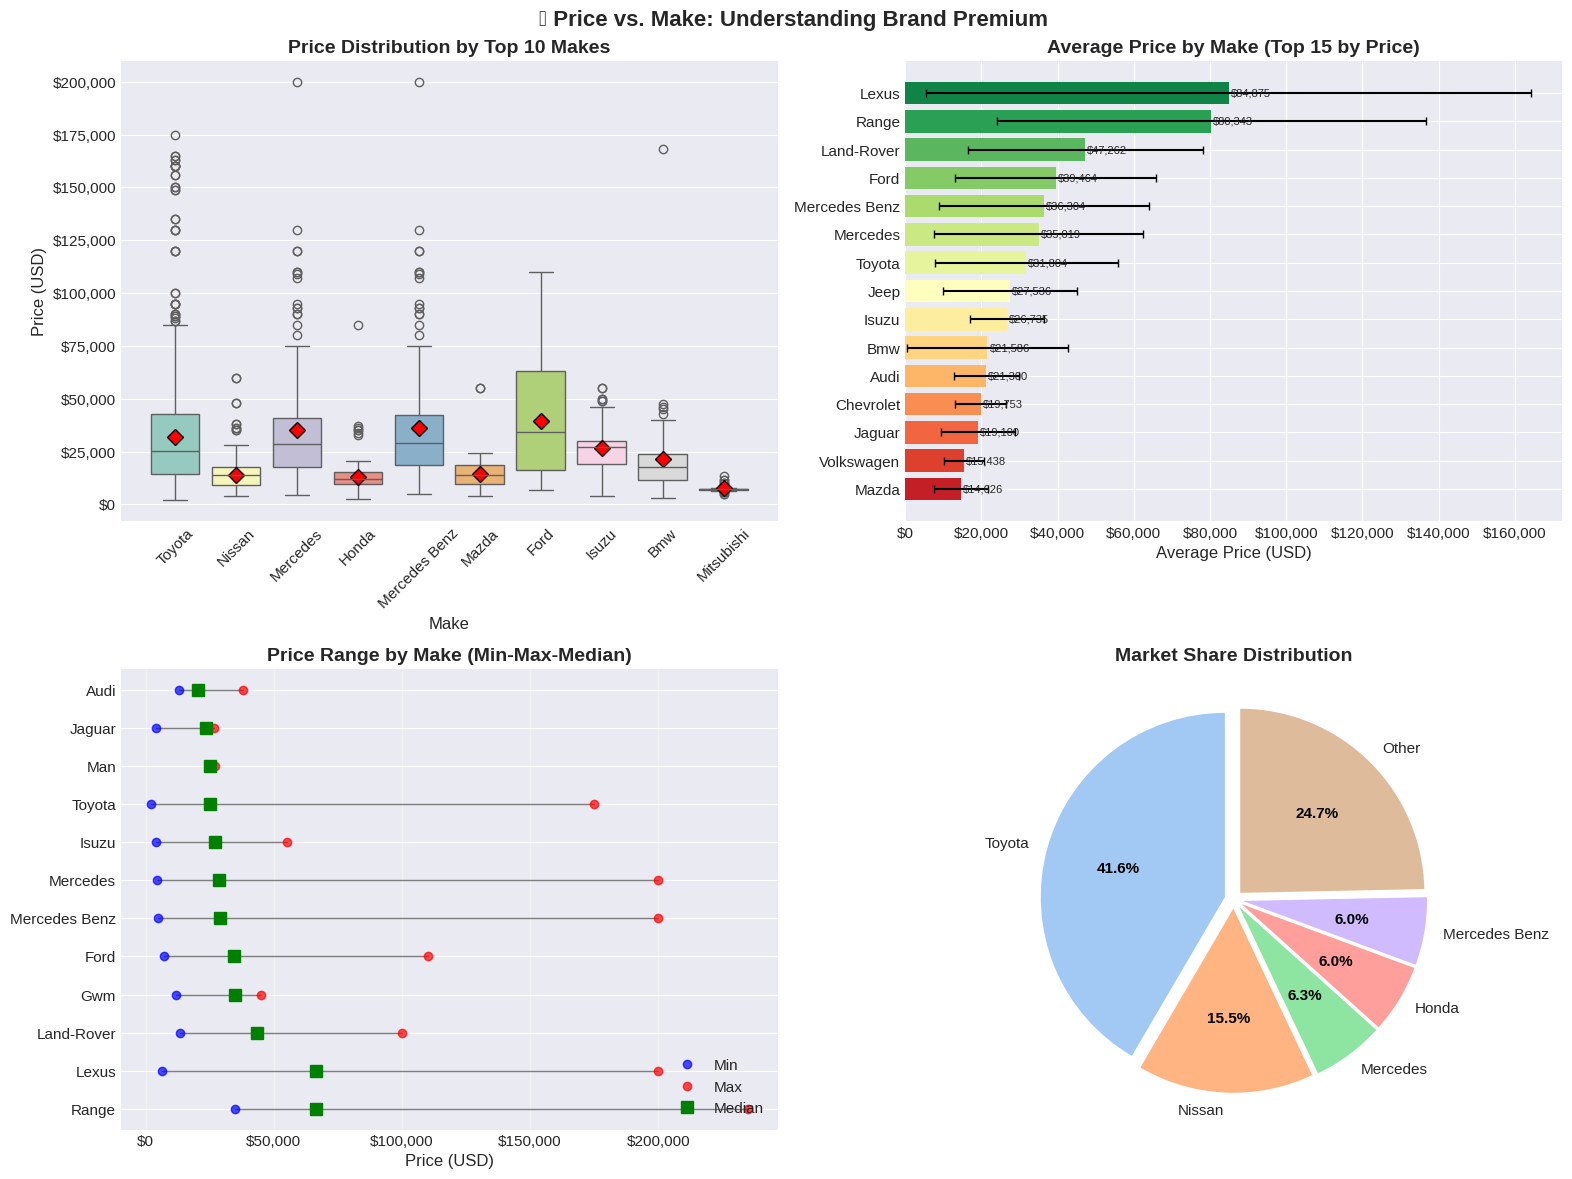
Market share in the region is heavily concentrated. Toyota commands 41.6% of total marketplace listings, demonstrating strong liquidity and value retention compared to European luxury brands.
D. Configuration & Transmission Premiums
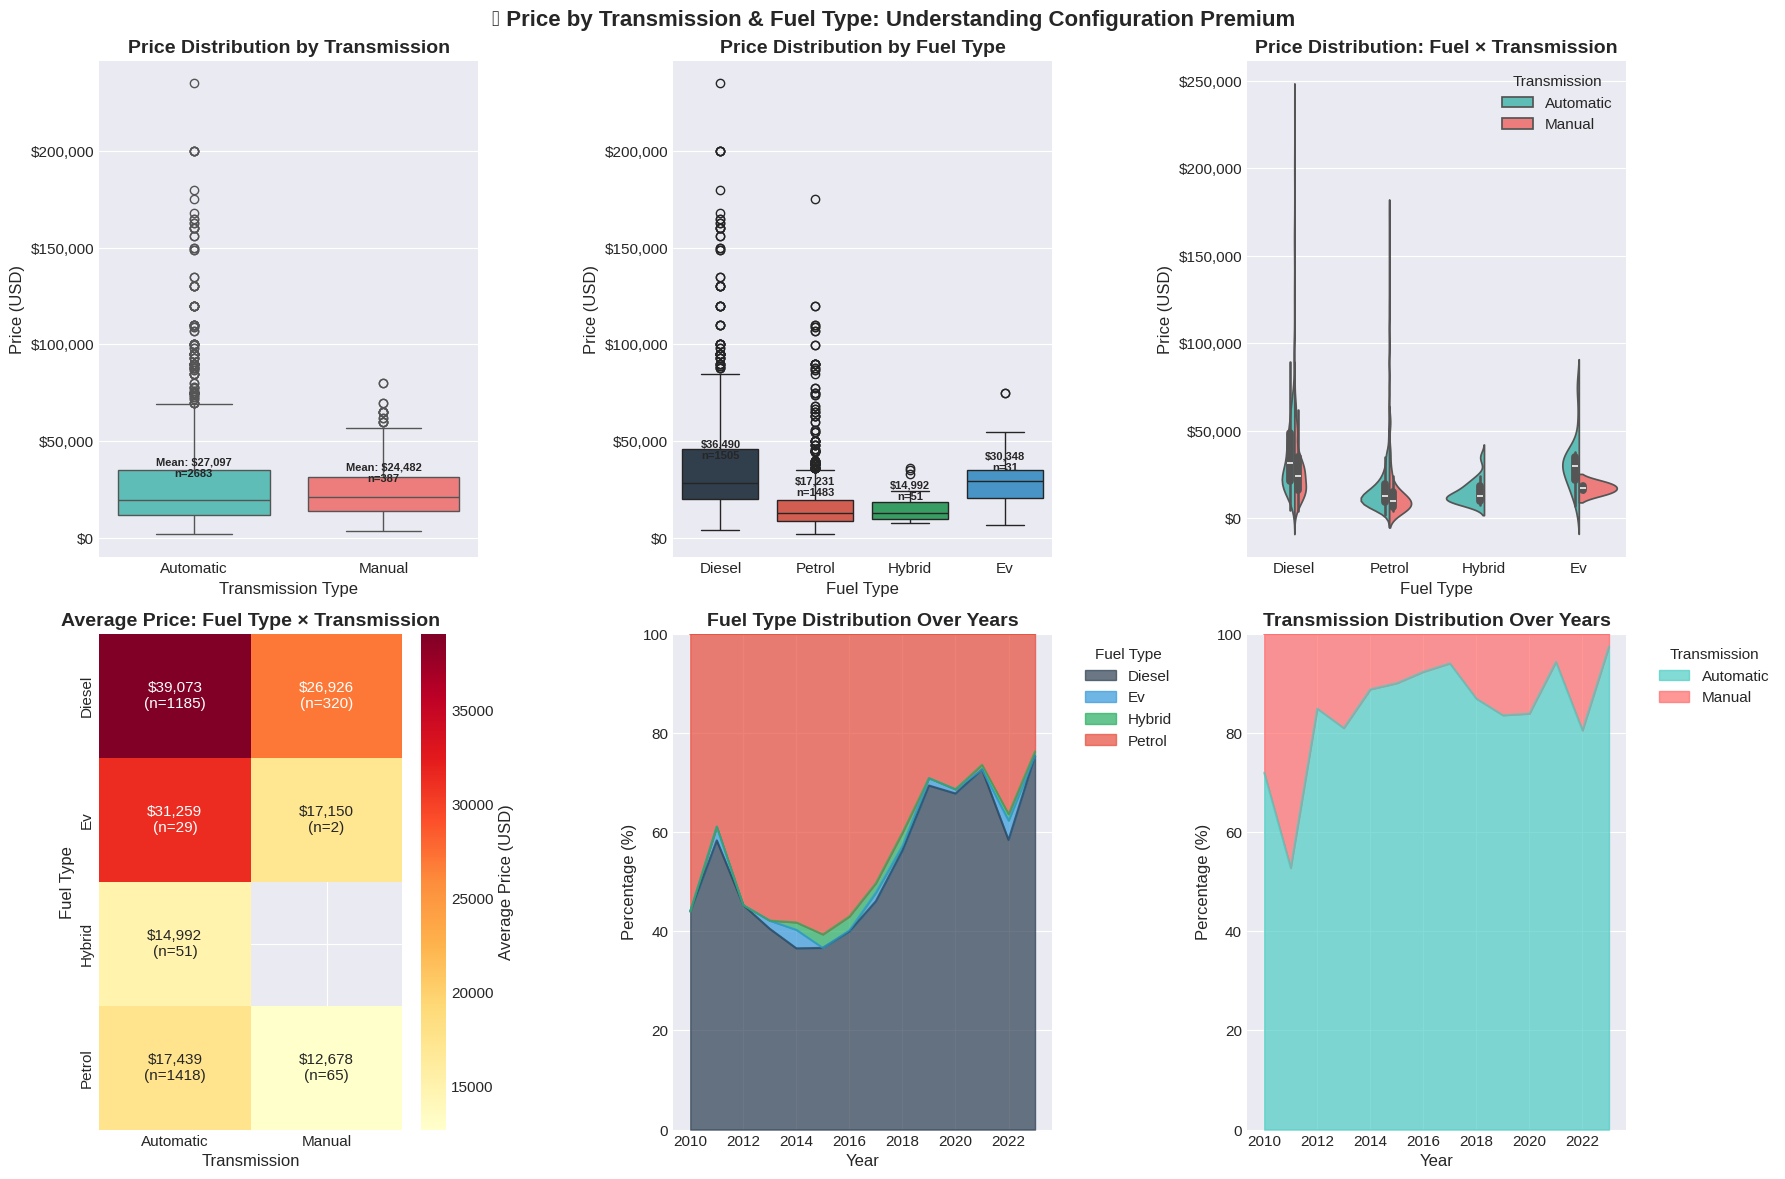
Automatic diesel configurations dominate the upper price brackets, driven by heavy utility demand (commercial trucks and off-road SUVs).
E. Mileage Velocities & Usage Relationships
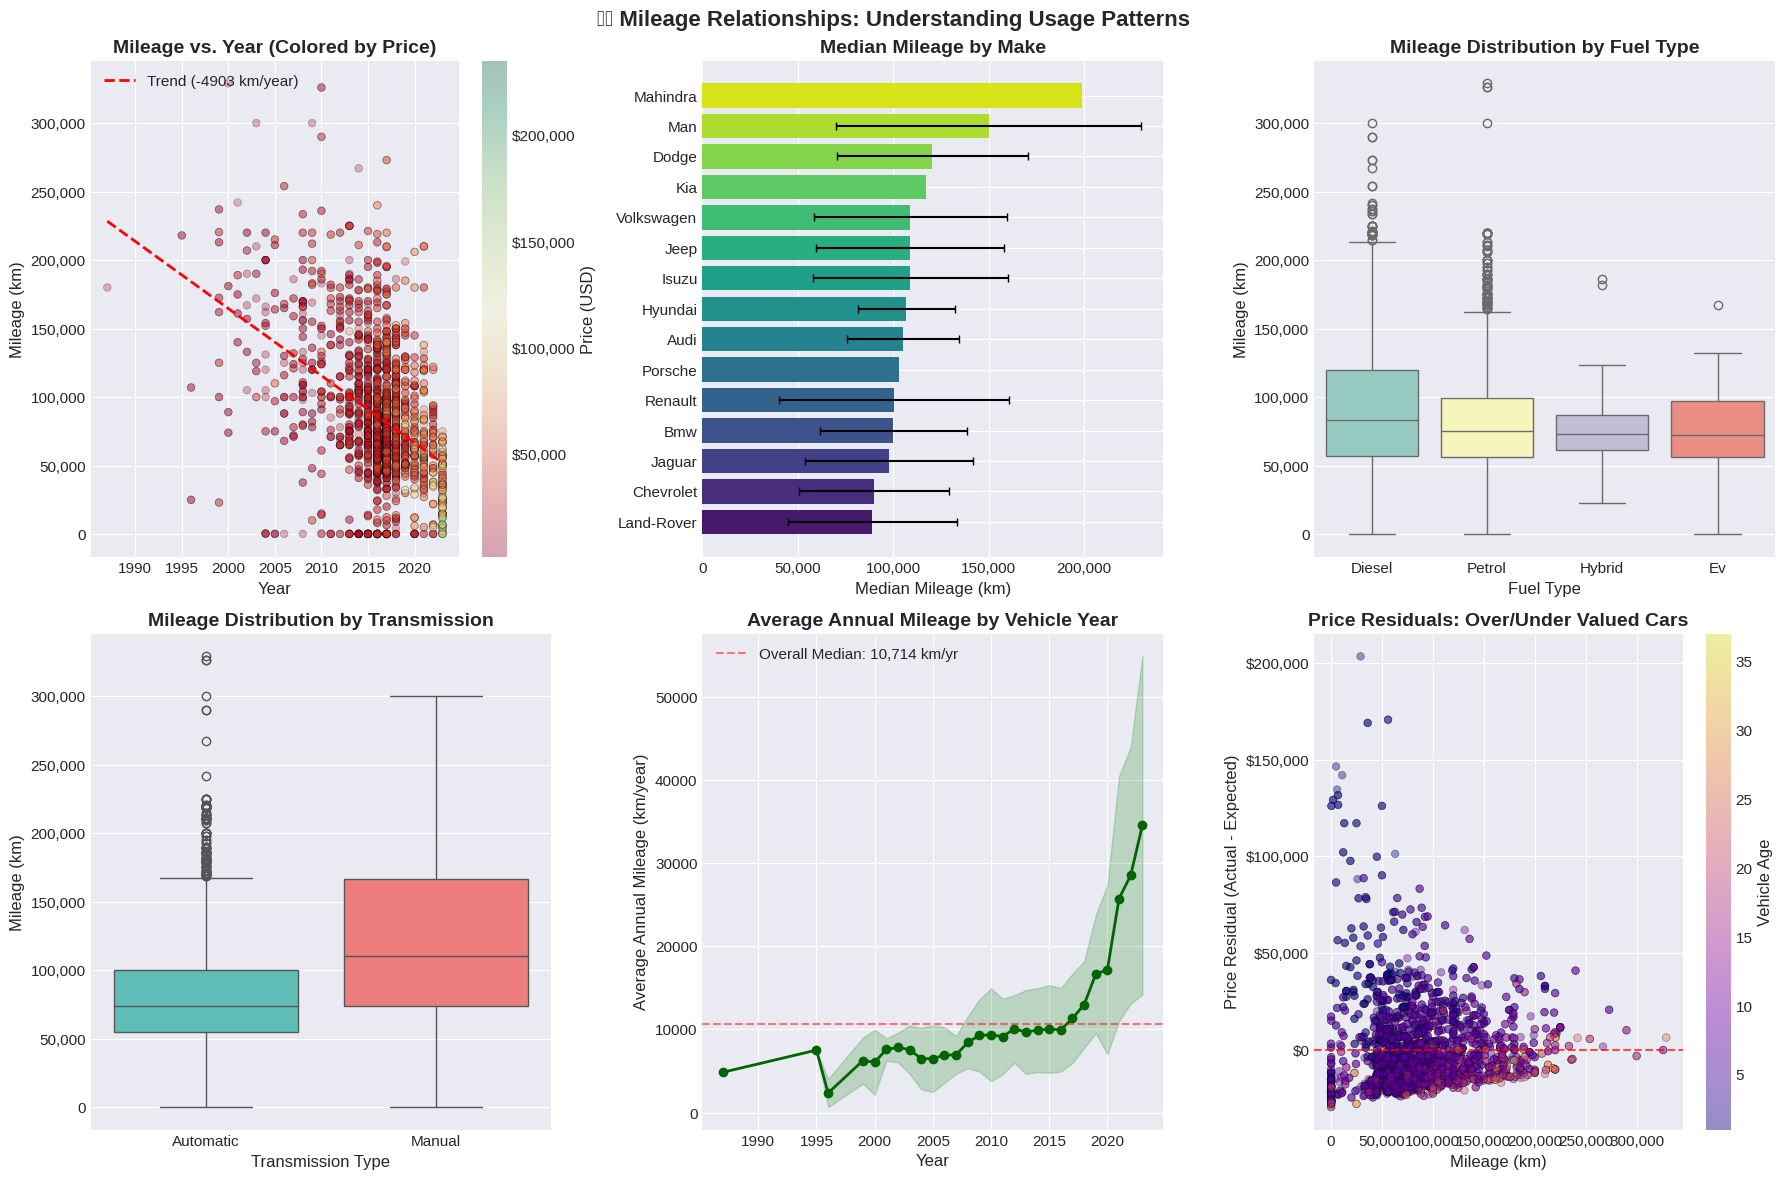
Calculating the annual usage rate ($\text{Annual Mileage} = \frac{\text{Mileage}}{\text{Age}}$) provides crucial insights into how intensely vehicles are driven relative to national baselines.
F. Brand-Specific Value Retention Curves
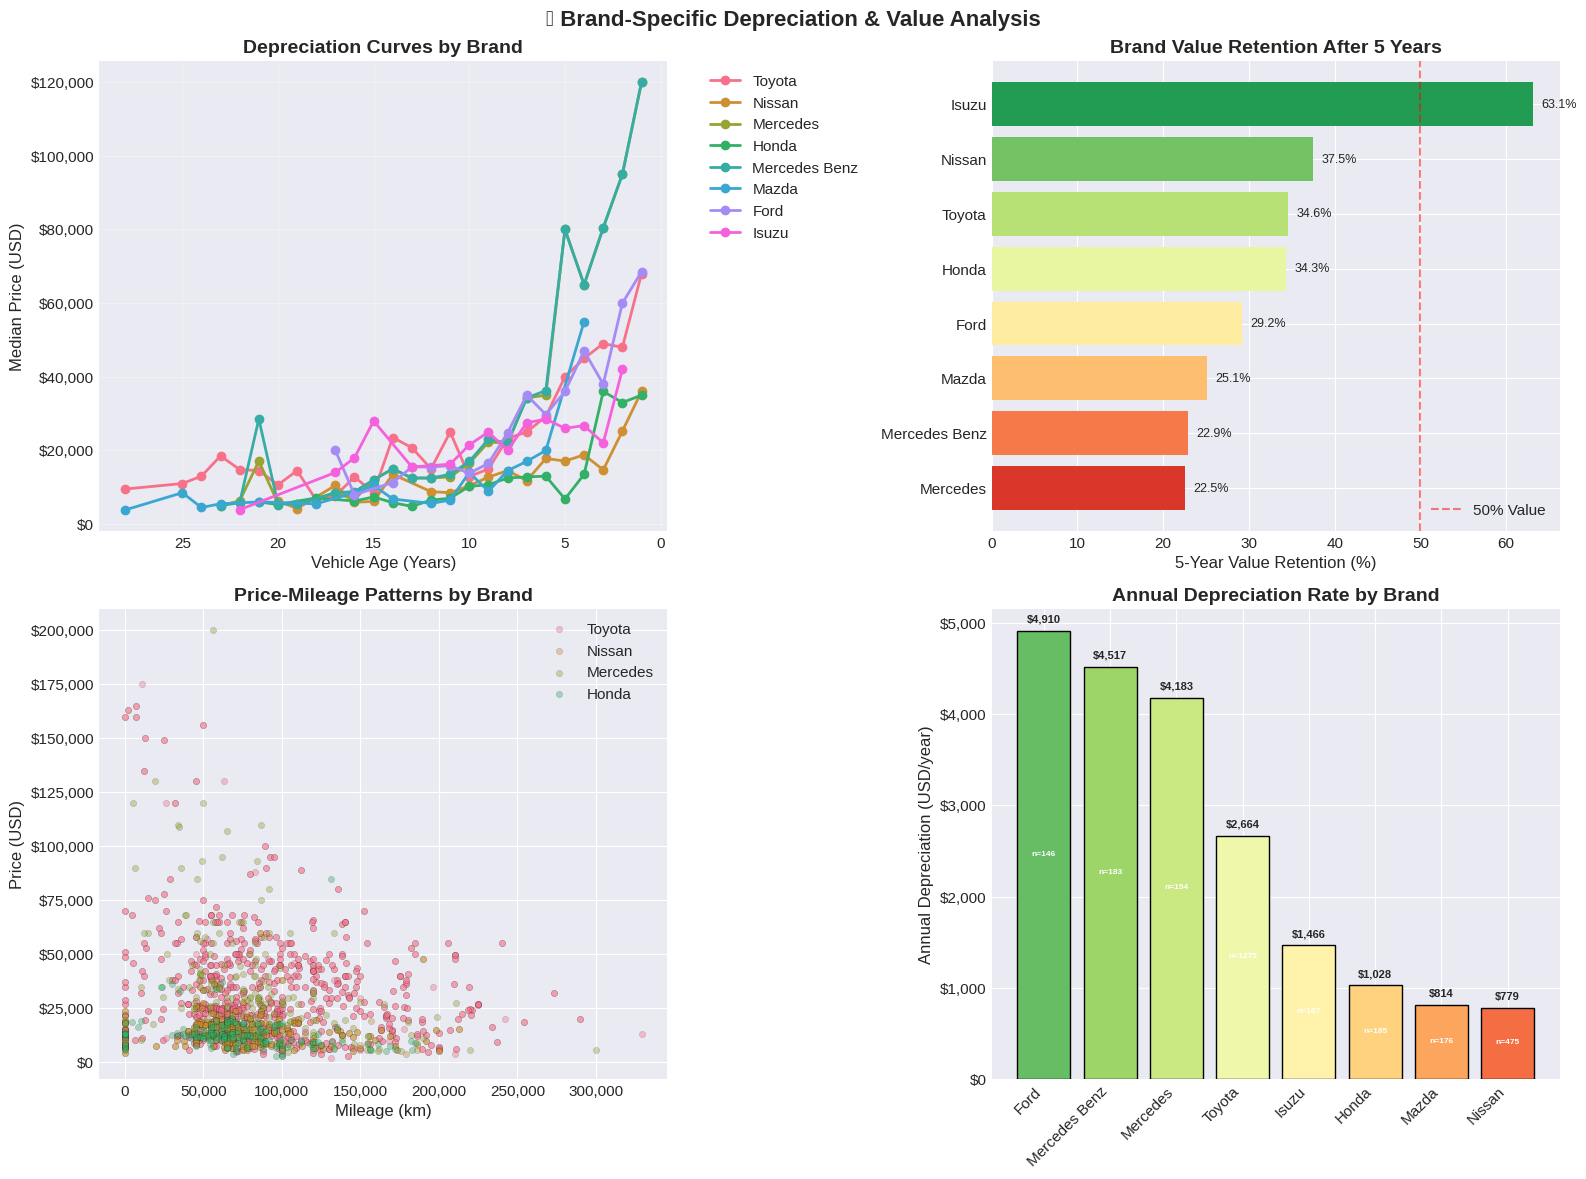
Different vehicle brands retain value at vastly different rates after 5 years of operation. Commercial brands like Isuzu retain up to 63.1% of their original value, whereas luxury sedans suffer steep 5-year drops.
G. Value Matrix & Segment Efficiency
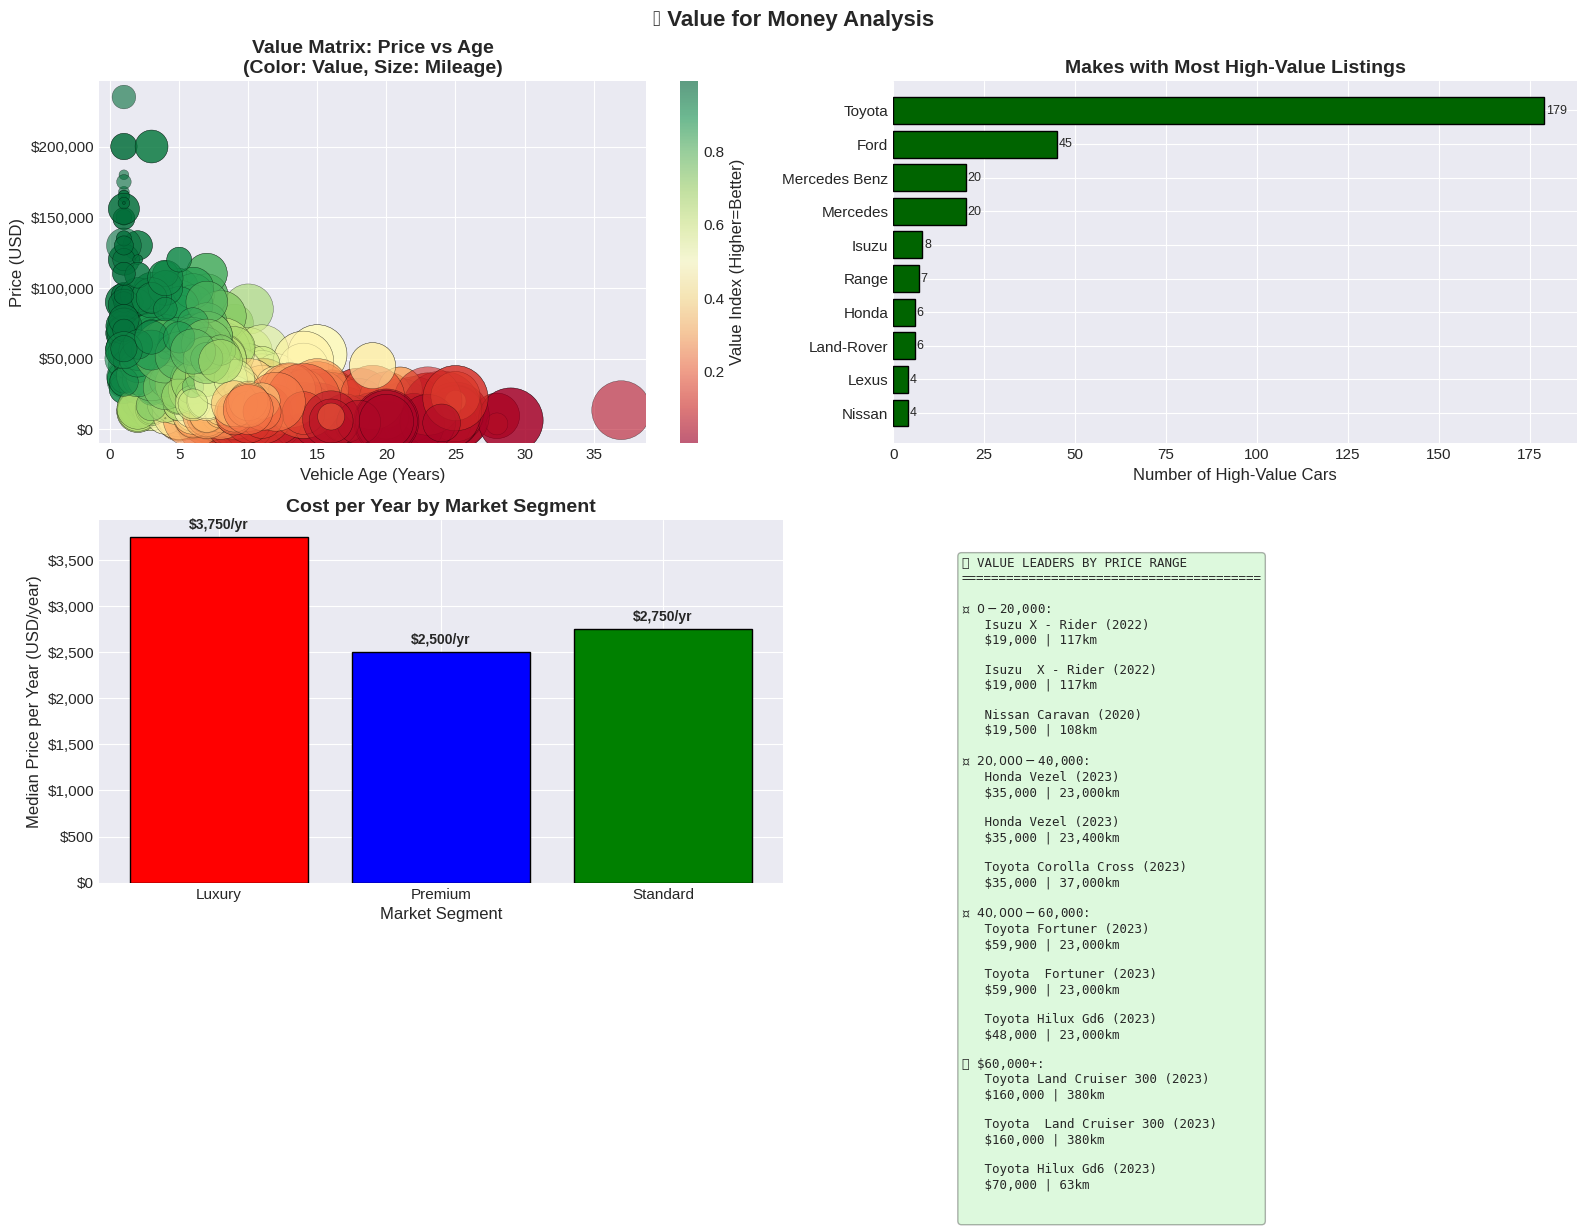
By mapping vehicle cost per operational year across market segments (Luxury, Premium, Standard), we isolate high-value listings that offer maximum functional lifespan per dollar spent.
H. Multivariate 3D Depreciation Surfaces
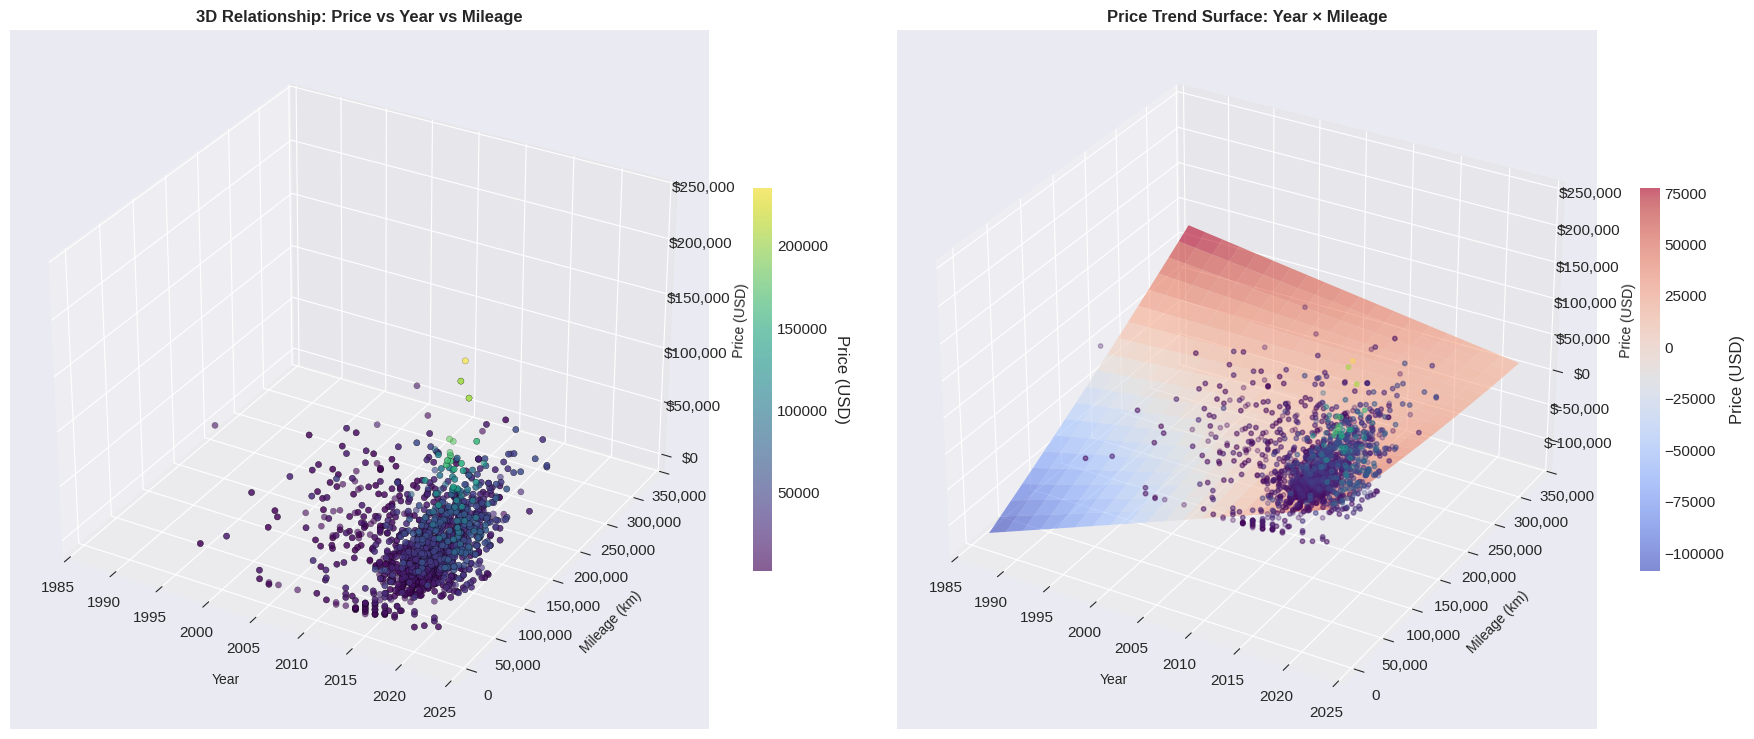
A dual-axis linear model is insufficient to capture price behavior. Mapping Price against Year and Mileage simultaneously reveals a non-linear regression surface.
I. Feature Correlation & Structure
A comprehensive correlation matrix confirms that while Year ($r = 0.476$) and Vehicle Age ($r = -0.476$) are strong linear drivers, interaction effects with Mileage and Market Segment require gradient-boosted decision trees.
⚙️ 3. Machine Learning Engine & The Overvaluation Fix
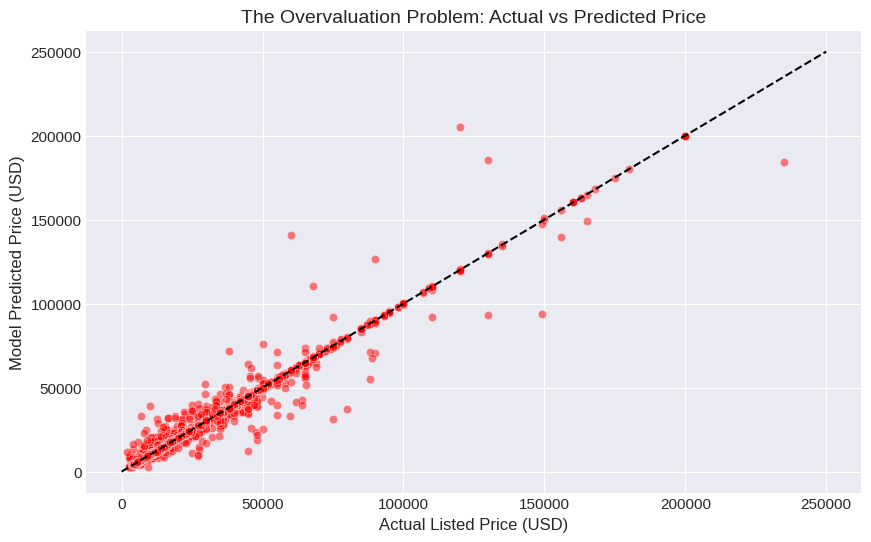
The Heavy-Tail Overvaluation Problem
When training standard decision tree regressors on raw dollar values, the objective function minimizes absolute dollar errors ($MAE = \frac{1}{n}\sum \vert{}y_i - \hat{y}_i\vert{}$). Consequently, a $$10,000$ error on a $$200,000$ Land Cruiser receives the same weight as a $$10,000$ error on a $$2,000$ Toyota Harrier.
This caused the baseline model to heavily overvalue low-cost, budget vehicles:
The Mathematical Solution: Target Log Transformation
To force the algorithm to evaluate relative percentage errors rather than raw dollar magnitudes, we applied a logarithmic transformation to the target variable. The XGBoost regressor was retrained on $y_{\text{transformed}}$ and evaluated by applying the inverse exponential function ($\text{expm1}$) to predictions.
Model Performance Summary
- Variance Explained ($R^2$): 0.790 (~79.0% of market price variance explained)
- Mean Absolute Error (MAE): ~$5,112.93 USD across all price brackets
- Evaluation Alignment: Low-end vehicle valuations mapped smoothly to true market benchmarks ($2,000 – $6,000 range).
🛡️ 4. Statistical Residual Governance & Arbitrage Rules
To differentiate genuine market bargains from typos or wrecked vehicles, a statistical residual governance engine was built using Z-score classification:
\[Z = \frac{\text{Actual Price} - \text{Predicted Price}}{\sigma_{\text{residuals}}}\]| Z-Score Range | System Classification | Actionable Meaning |
|---|---|---|
| $Z \ge +1.5$ | ❌ Overpriced | Asset listed above fair market trend line |
| $-1.2 \le Z < +1.5$ | 🟢 Standard Market Value | Fair competitive pricing tier |
| $-2.5 \le Z < -1.2$ | 🔥 Verified High-Value Deal | Strong arbitrage opportunity |
| $Z < -2.5$ | ⚠️ High Risk / Deep Discount | Suspected mechanical damage, salvage title, or listing typo |
🚀 5. Interactive Dashboard Deployment
The final model was compiled with serialized encoders (joblib) and deployed via a dynamic Gradio web application featuring:
- Cascading Dynamic Dropdowns: Selecting a vehicle brand (e.g., Toyota) dynamically filters the model choices (e.g., Hilux, Prado, Aqua).
- AI Thought Logs: Visual breakdown showing base market pivot, age modifiers, mileage wear penalties, and brand adjustments.
- Target Bargaining Bounds: Automated calculation of target purchase goals (floor) and maximum walking ceilings.
```python
Launch Configuration for Production
if name == “main”: demo.launch(server_name=”0.0.0.0”, server_port=int(os.environ.get(“PORT”, 7860)))